Exposure Tape
Every Strike. Every Greek.
Full-chain gamma, delta, charm, and vanna, mapped strike by strike from 0DTE to LEAPS. See exactly where dealers are forced to hedge.
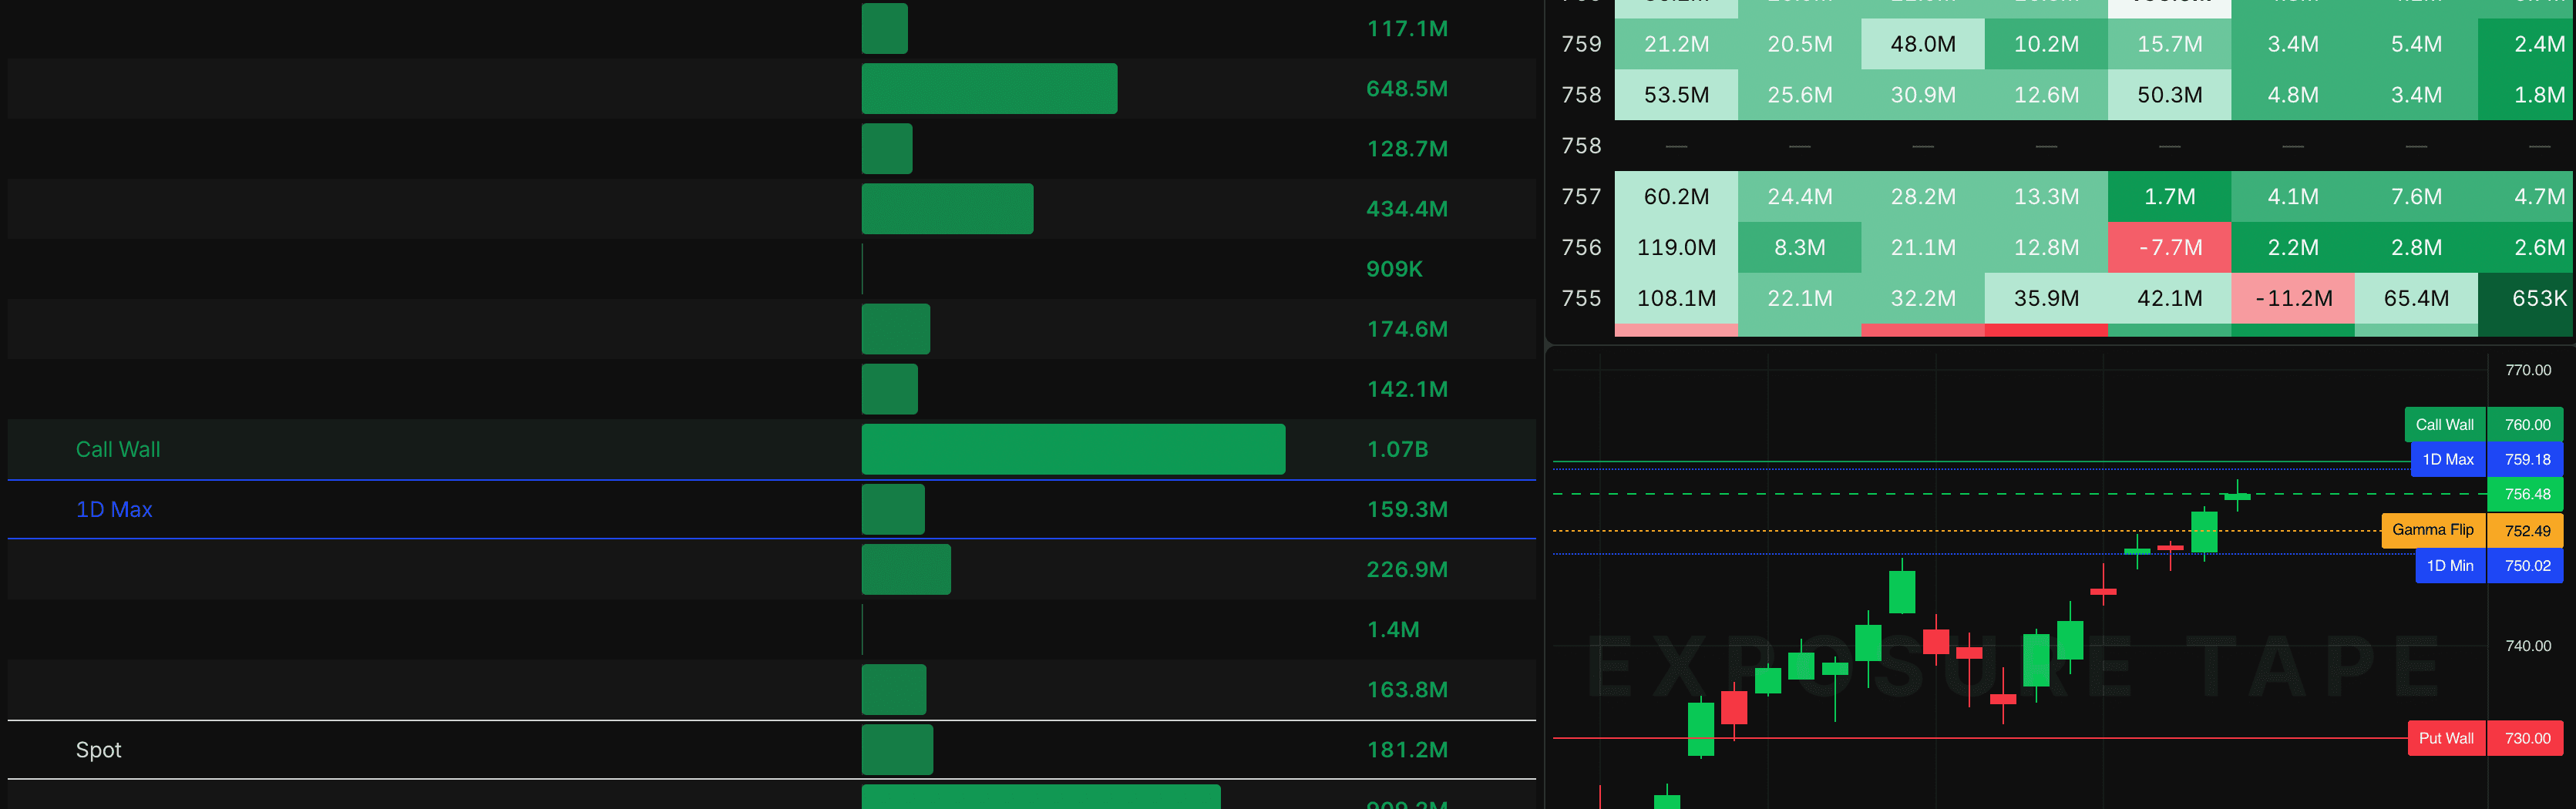
Expo shows dealer positioning across every strike and every expiration. Gamma, delta, charm, and vanna update on every print, so you know where market makers sit at any moment of the session. From there, you can tell which strikes dealers will defend, where price tends to pin, and which zones suppress or amplify vol. Most flow tools stop at the print. Expo shows you the hedge that follows.
Every strike. Every expiry.
0DTE through LEAPS, every strike. Scroll the chain, filter by expiry, expand any row.
Gamma. Delta. Charm. Vanna.
Refreshes on every print. All four Greeks in the same panel, on the same clock.
Every Wall. Every Level.
Call wall, put wall, and gamma flip flagged automatically. The strikes price tends to hunt.
Field. Chart. Matrix. Table.
Four views, same data. Map the hedging, draw it on candles, or break it out strike by strike. Open up to 4 panels at once.
The hidden side of every move.
Every panel, and what it tells you before the chart does.
The dealer's hand, mapped.
The Field paints forced dealer hedging right behind the candles. The bright bands are the walls price reacts to, and the blob into the close marks where gamma pins the day.
Switch the Greek and the whole field recolors. Change the expiration and the level slides to match.
Every level you trade, up top.
Flip zone, both walls, net exposure, and the day's expected move sit above every chart.
Each card names the regime too, so you read the level and the context in one look.
Switch the Greek, the screen follows.
The Matrix lays the whole chain out as a heatmap, green where dealers sit long, red where they sit short.
Drop into the Table for the same ladder strike by strike, every Greek a click away.
Every level, on the candles.
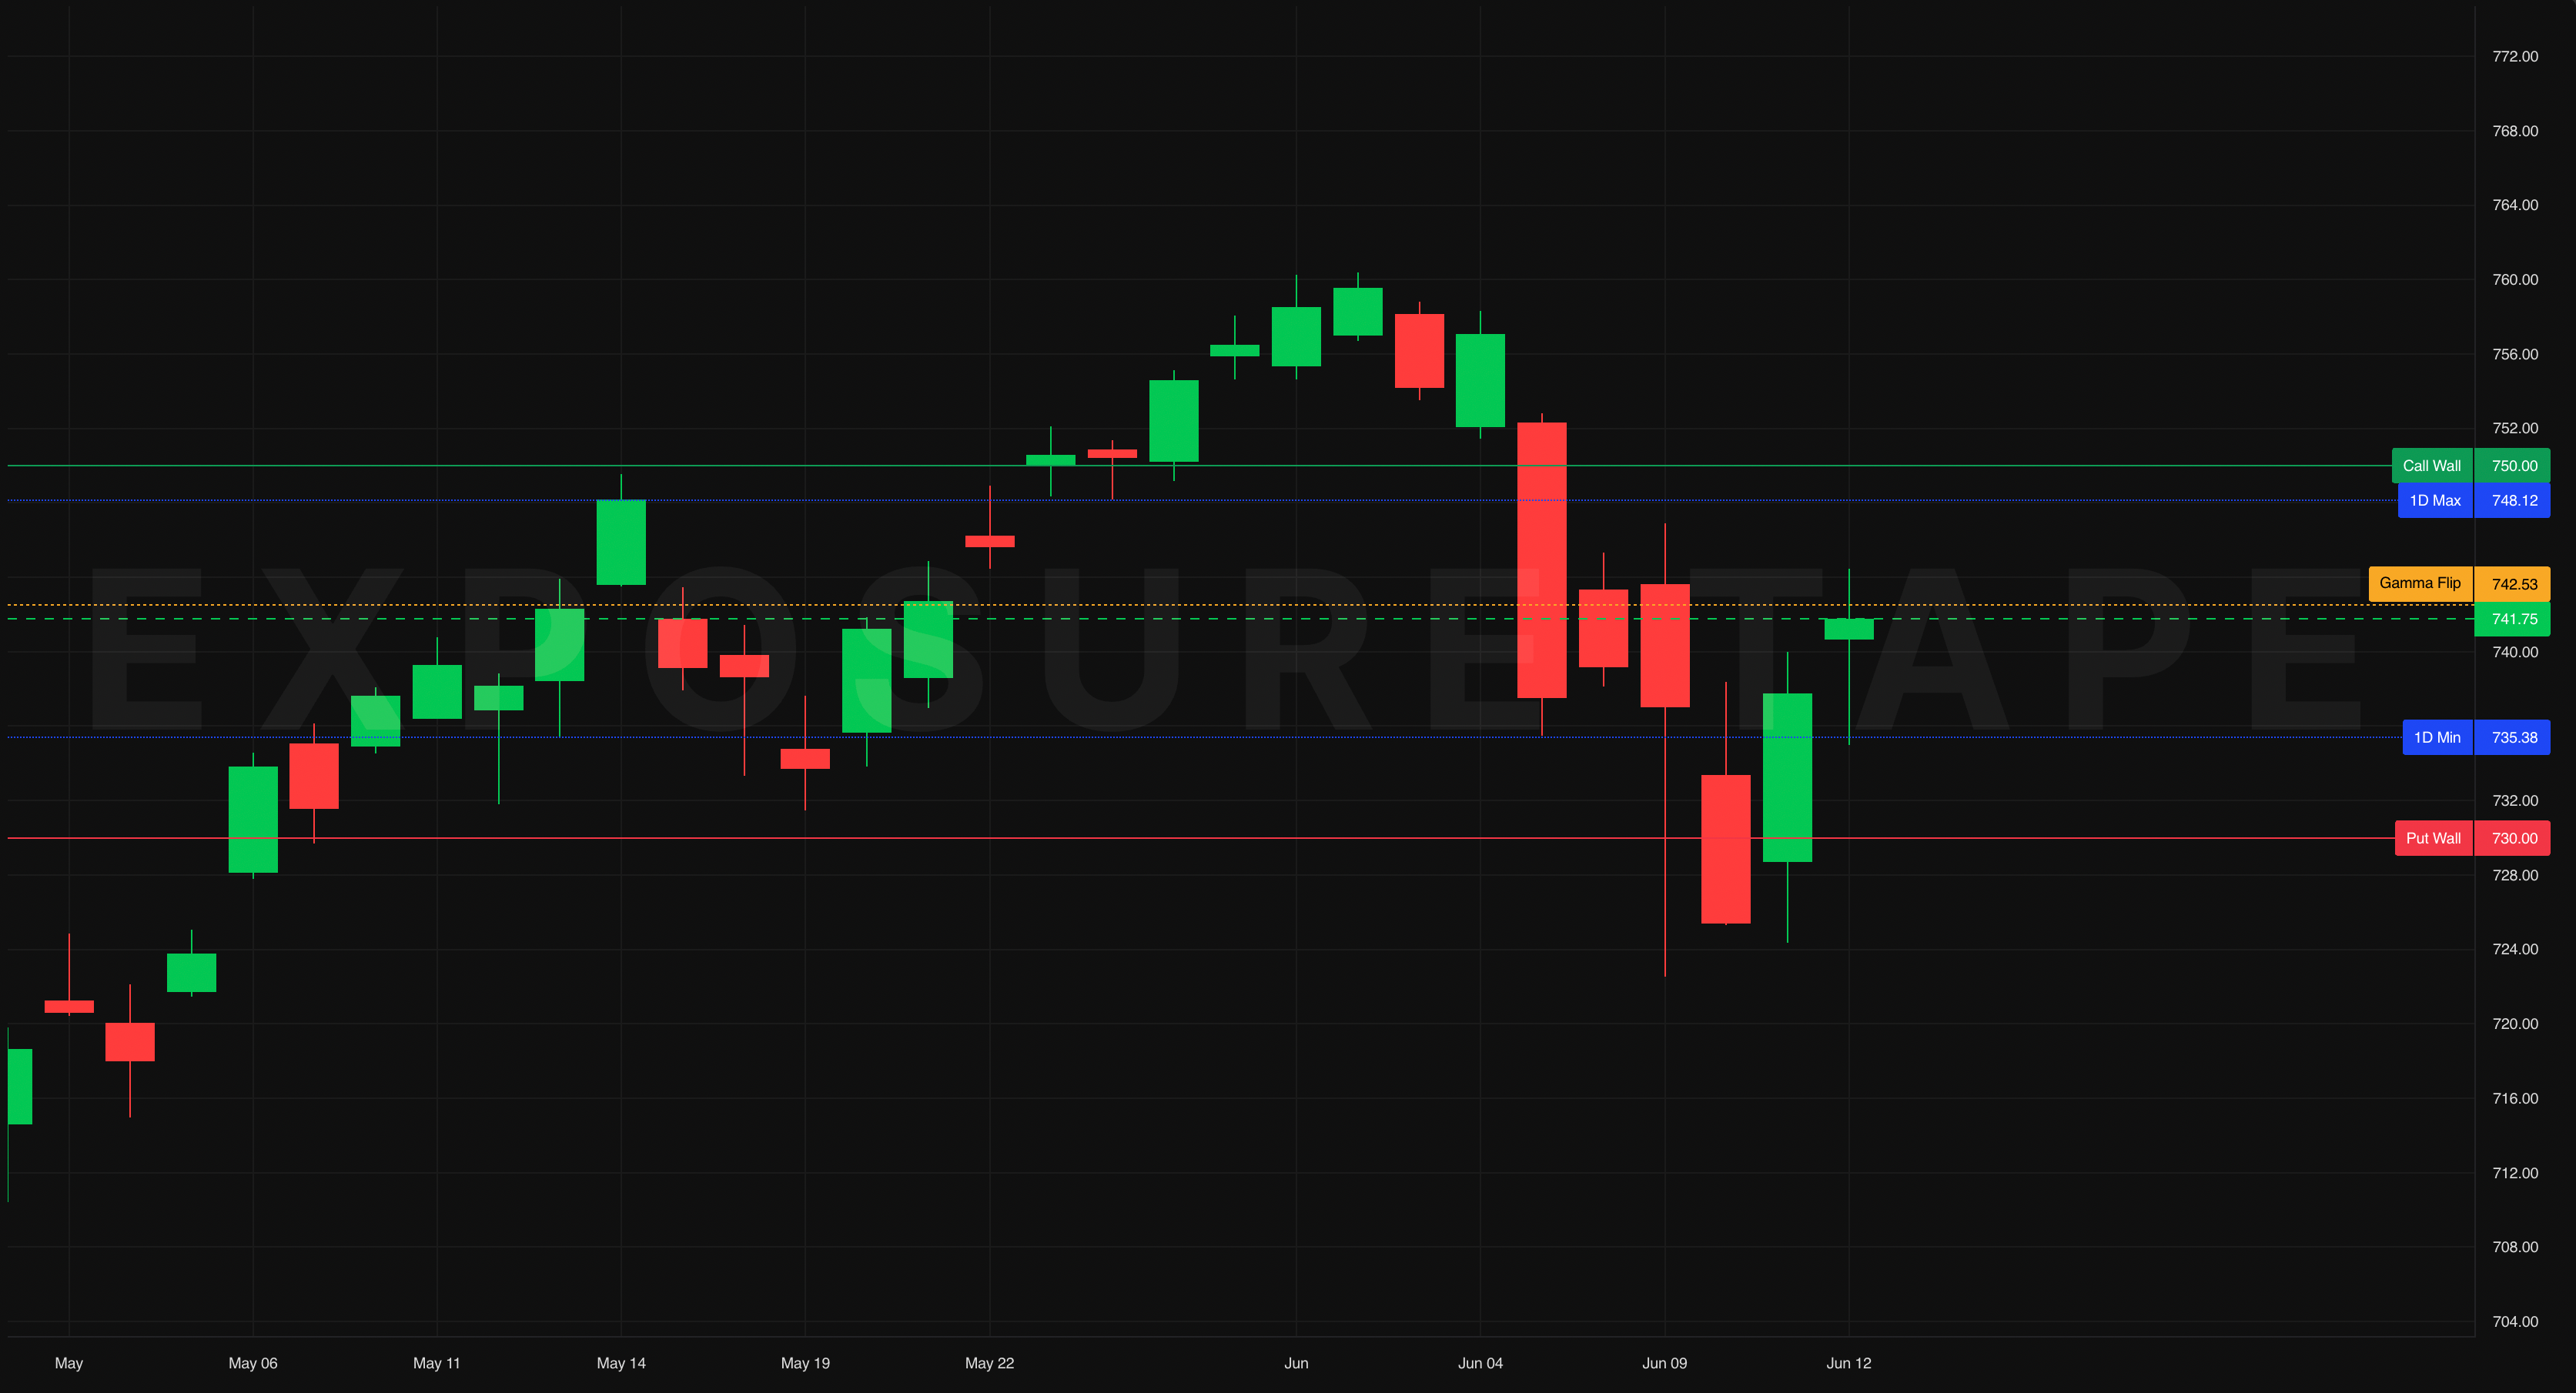
Every dealer level, straight on the chart: the walls, the gamma flip, and the day's range.
Zoom from the daily trend into the session, or stack every Greek's levels at once.
Run four panes at once.
Split into a grid and give every pane its own ticker, Greek, and expiration.
Link them with sync, resize the seams, and rebuild the layout as the session turns.
The cockpit around the chart.
The bar above sets what you see. The rail beside keeps your symbols, alerts, and flow one click away.
The top bar is built for Expo. Switch ticker, swap between chart, matrix, and table, change the Greek, and filter to any expiration without leaving the screen. Down the right rail sit your Watchlist, your Alerts, and a full Ticker Details dashboard, each one tracking whatever symbol you have active.
More Essentials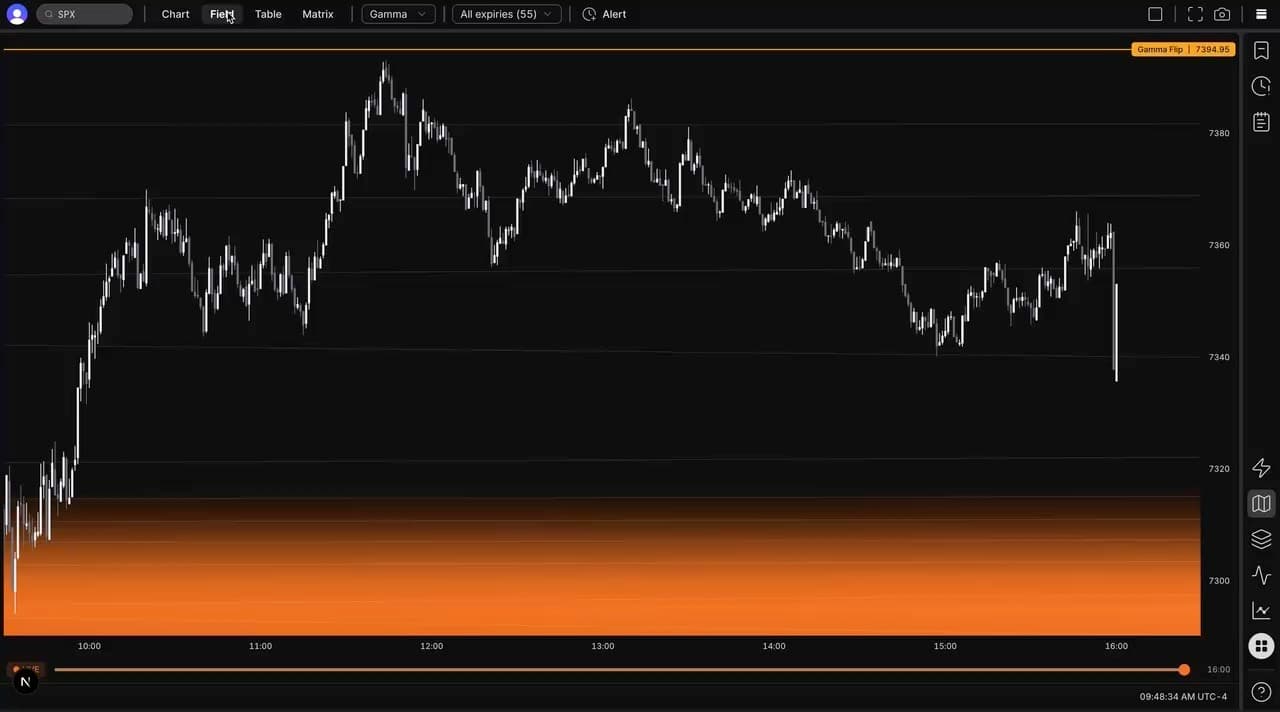
Watch a playlist of quick videos on the Essentials panel.
The options market has never been bigger, or faster.
of SPX options volume now expires the same day. Dealer hedging plays out in minutes, not days.
options contracts traded in 2025, a sixth straight record year and up 26% on 2024.
of all U.S. options volume is now 0DTE, up from 21.5% a year earlier. The shift is only accelerating.
Source: Cboe Global Markets and the OCC, 2025 full-year data.