 Exposure Tape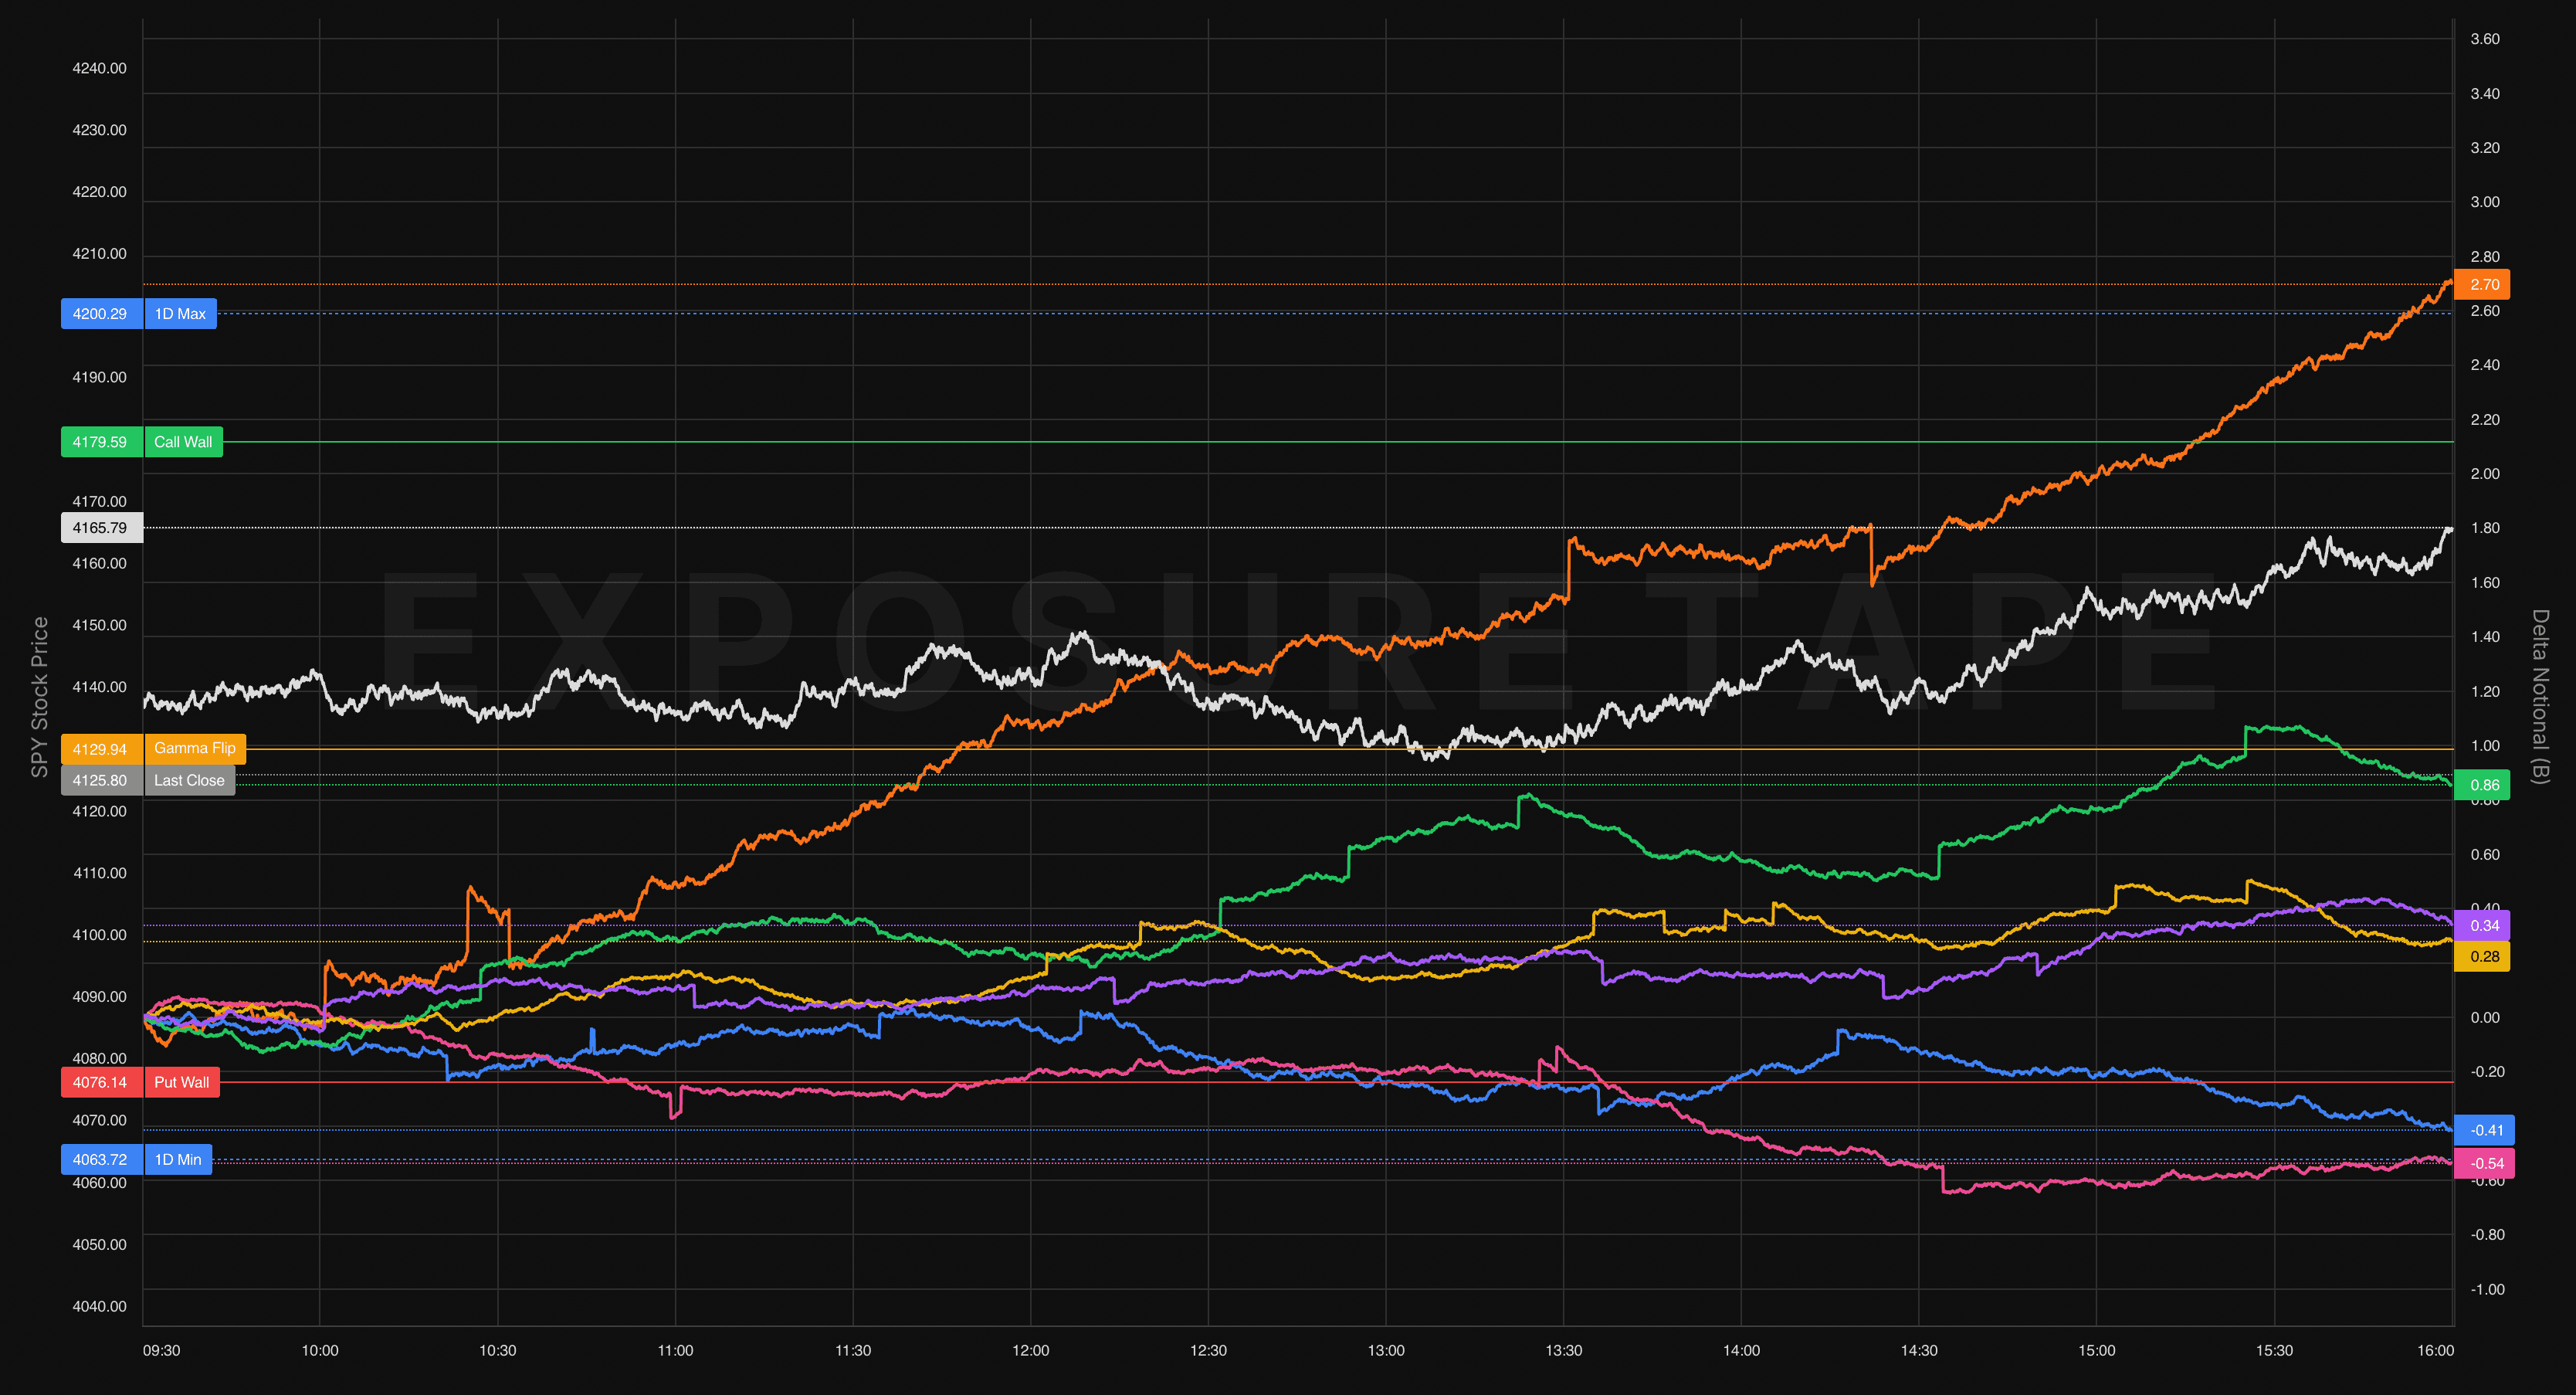
Spot the Move. Before It Happens.
Real-time options flow, drawn as a live line. See who's buying, who's selling, and which side they're taking, the moment it happens.
Every options trade forces the dealer on the other side to hedge in the underlying. Buy a call and the dealer buys stock. Buy a put and the dealer sells. Heat sums that forced flow across the whole tape and plots it live, so you watch dealers being pushed into the market as it happens. When the flow ramps, price usually follows within one to five minutes. The white line is spot. The colored lines are the dollars dealers are forced to push through the stock, split by who is trading and which side they're on. The same read institutional desks have always had, now on your screen at five-second resolution.
The dealer's forced hand.
Every options trade pushes the dealer to hedge in the stock. Heat sums that flow live, so you see the buying and selling before it hits price.
All, next expiry, or retail.
Three cohorts split the flow. Watch the whole market, just the front month where 0DTE lives, or retail on its own.
Calls and puts, separated.
Total mode nets each cohort to one line. Put/Call splits them into six, so you see exactly which side is driving.
Walls and flip, on the line.
Call wall, put wall, gamma flip, and the day's expected range overlay the chart. The same levels desks trade against.
Read the flow before the price.
What Heat plots, and how desks trade it.
The forced flow, as it forms.
Heat sums the dealer hedge from every options trade and plots the running total live. When the line ramps, dealers are being pushed to buy or sell stock, and price usually follows within one to five minutes.

Whole market, front month, or retail.
Three cohort lines: All, Next Expiry where the 0DTE flow lives, and Retail flagged by lot size and pattern. When retail keeps lifting but All flatlines, the crowd is offside.

One net line, or all six.
Total nets each cohort's calls and puts into a single curve for the clean read. Put/Call splits them apart, so you see whether calls are rallying on retail or institutions.

The levels desks trade against.
Toggle Key Levels for the call wall, put wall, gamma flip, and expected range, drawn right on the price axis. Show Alerts and Extended Hours layer on with one click each.

Spot is the lag, not the lead.
Watch All Calls ramp while spot sits flat and you're seeing dealers forced to buy before the move. The gap between flow and follow-through is short, but it's the whole edge.

The cockpit around the chart.
The bar above sets what you see. The rail beside keeps your symbols, alerts, and flow one click away.
The top bar is built for Heat. Switch between Total and Put/Call, turn the cohorts you care about on or off, and overlay your alerts, key levels, or extended hours, all without leaving the chart. Down the right rail sit your Watchlist, your Alerts, and a full Ticker Details dashboard, each one tracking whatever symbol you have active.
More Essentials
Watch a playlist of quick videos on the Essentials panel.
Most of the market now moves in real time.
of SPX options volume expires the same day. The flow plays out in one session.
of short-dated options volume is retail. Heat splits it out as its own line.
of all US options volume is now 0DTE, up from 21.5% a year earlier. The shift is accelerating.
Source: Cboe Global Markets, the NYSE, and the OCC, 2025 data.


